(Updated Below)
On April 30th, the Department of Education released funding tables (by program and by state) for FY 2012 and FY 2013 appropriations, and FY 2014 estimates. As a result, we now know the final estimated total allocation for WIA Title II (or AEFLA) Adult Basic and Literacy Education State Grants for FY 2013: $563,954,515. This includes $70,811,239 for English Literacy and Civics Education State Grants. That’s a cut of about $31 million dollars of federal support for adult literacy in comparison with FY 2012. (But it’s worse than that when you adjust for inflation—see below.)
Fiscal years 2012 and 2013 are based on currently enacted appropriation bills, and the amounts listed for FY 2013 include the effect of the sequester and an across-the-board cut in the final appropriation. FY 14 estimates are based on the president’s proposed budget, and barring a miracle, those estimates are well over what we’ll actually see in the final FY 2014 appropriation.
These tables also include the estimated state allocations. I’ve pulled those out for you here:
These tables were updated yesterday, but no changes were made to the WIA Title II grants, at least as far as I can tell.
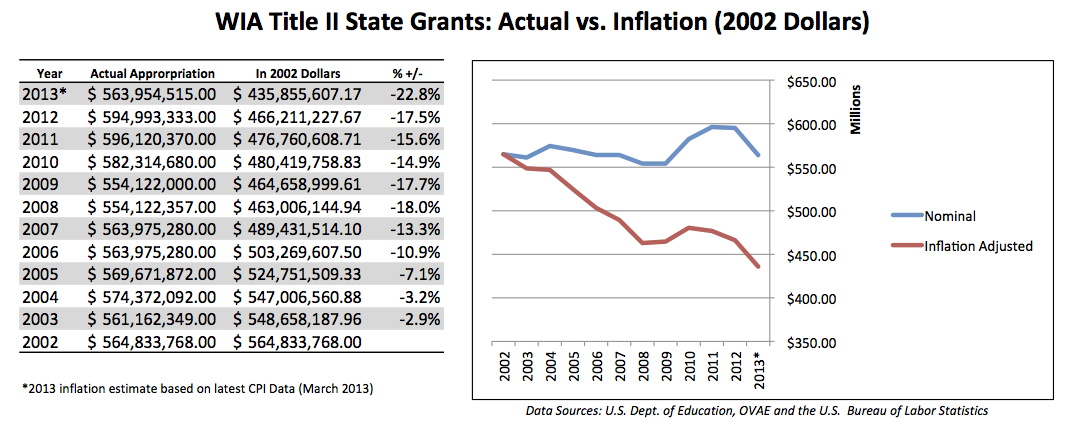
As I mentioned above, federal funding for adult education is even more grim once you adjust for inflation. Based on these figures, I took a stab at estimating the buying power of $563,954,515 in 2002 dollars. I used that figure because the last time I saw this calculated, 2002 was used as the baseline. I plan to follow up at some point with a longer post on calculating the effect of inflation, and the effect of using different baselines (and maybe even different methods, too) but for now this seemed like a good place to start. (For FY 2010, I did not include the one-time adjustment made by the Department of Education to make up for several years of underpayment to some states—that anomaly wasn’t carried over and shouldn’t be interpreted as growth, so I left it out.) (Note: this chart was updated 02/18/14.)
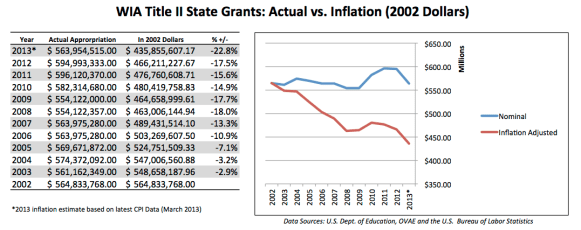
Using the most recent CPI (March), I calculate that $563,954,515 equals about $435,855,607 in 2002 dollars. Again, that’s a rough estimate, using the March CPI (for the other years I can use an annual average), but it’s close enough. The main takeaway here is that pre-sequestration the field was receiving somewhat stable, more-or-less flat, funding (that’s the blue line)—even, arguably, with the 2013 cut—but once you adjust for inflation (the red line) you can see that the field has actually lost about 23% in real dollars in comparison with the appropriation of 2002.
Finally, don’t forget that other federal programs that are vital to adult education programs (Community Development Block Grants, CNCS/AmeriCorps, grants from USCIS, etc.) were also subject to sequestration cuts.
That’s a lot to chew on. Take a look and let me know if you have any comments or corrections.
UPDATE 2/18/14: This table has been updated to reflect the final 2013 CPI numbers.