The Center for Public Policy Priorities has just issued a report, “The Texas GED Problem Is Getting Worse,” which traces the steady decline in the number of Texans attempting to pass the GED over the last five years.
Some news coverage here:
The Center for Public Policy Priorities has just issued a report, “The Texas GED Problem Is Getting Worse,” which traces the steady decline in the number of Texans attempting to pass the GED over the last five years.
Some news coverage here:
A few years ago I started tracking the annual federal appropriation for adult education under the Adult Education and Family Literacy Act (AEFLA, incorporated as Title II of the Workforce Investment Act and later the Workforce Innovation and Opportunity Act), in both nominal amounts and, importantly, in inflation-adjusted dollars. I’ll update this again at the end of the year once the final annual inflation rate is announced, but in light of the fact that Congress will be coming back next month to finish up the FY 2017 appropriations process (several months after it should have been completed), I thought it might be a good idea to post a preliminary update now, so everyone is clear on how small the federal investment in adult education has been over the last 14 years.
Let’s start with a chart included every year in the Committee for Education Funding’s annual “Budget Response” book, in the article on AEFLA (an article I have written the last several years, I should add). It shows the nominal amounts appropriated for AEFLA state grants since 2002:

There are actually two line items for AEFLA funds in the federal budget: Adult Education State Grants and National leadership Activities (AEFLA section 242). We highlight the state grants line item in the CEF book because those are the dollars that are distributed by formula to states to actually fund adult education programs. (It is also by far the larger of the two amounts.) See this old post for an explanation of how the funding for adult education is divided up.
Looking quickly at this bar chart, you might be tempted to think that AEFLA state grant funding has been fairly steady—the bars look pretty even—but if you look closely you can see that there was a rather dramatic drop in funding in 2013. This was the year we (along with every other federal non-defense discretionary program) got socked with the sequester, an automatic spending cut required by the Budget Control Act (BCA) of 2011. It doesn’t look that dramatic in this chart, but this was a cut of over $30 million dollars—a significant loss of funding when you consider our entire appropriation for this line item is less than $600 million. While there has been minor sequester relief since then, you can also see from this chart that, as of FY 2016, we have not yet returned to pre-BCA funding levels.
A couple of additional notes about this chart:
Last year, thanks in large part to the efforts of Rep. Rosa Delauro (D-CT) and other House appropriators, AEFLA state grants got its most significant bump up in a while in the FY 2016 omnibus spending bill ($13 million), but, again, it’s important to note that AEFLA funding has still not yet returned to the pre-2013 levels. In addition, the overall appropriation for AEFLA in FY 2016 ($585 million) is considerably less than the amount authorized for AEFLA under WIOA ($622 million).
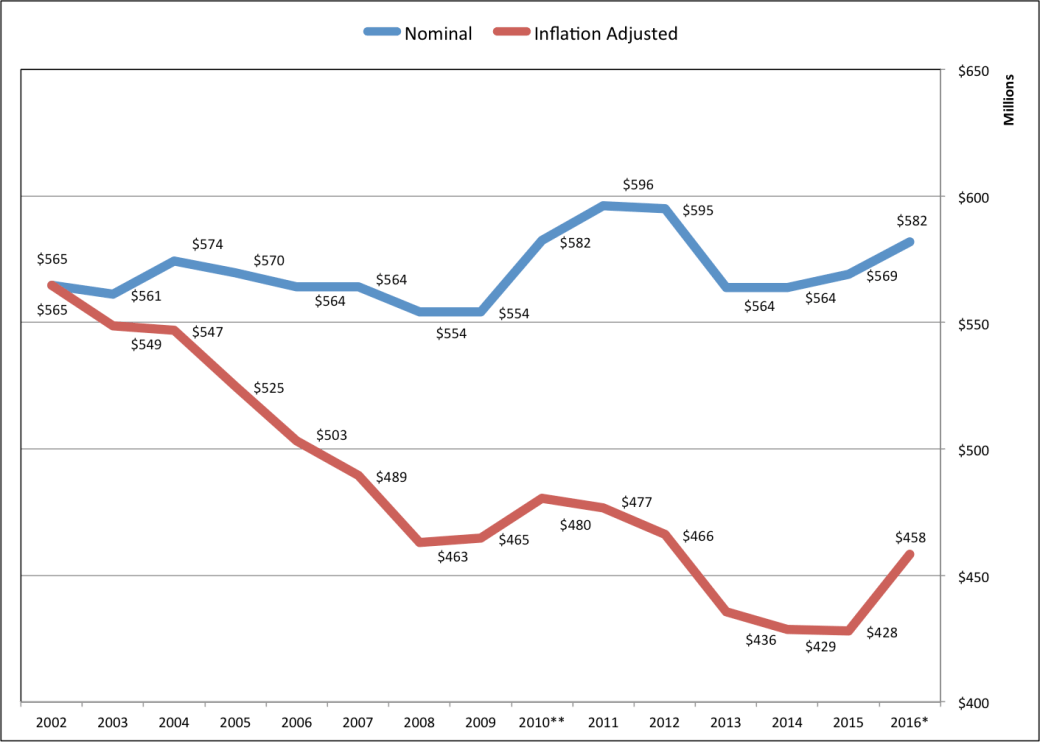
The situation looks considerably worse once inflation is taken into account. The buying power of 2016 dollars is less than it was in 2002. This chart shows the buying power of the AEFLA appropriation since 2002 in 2002 dollars.
Data Sources: U.S. Dept. of Education, OVAE and the U.S. Bureau of Labor Statistics, except as noted below.
*Actual 2010 appropriation included a $45,906,302 one-time adjustment. This is not included.
**Average inflation rate over the first nine months of 2016.
My inflation calculation from 2016 is using the average monthly CPI through September, so it’s a rougher estimate (for the other years I can use the annual average), but it’s good enough. (I realize also that there is debate about whether the CPI is a meaningful way to measure the rate of inflation for the costs related to running an education program, but it’s fairly standard to use this measure. We can all agree that cost have gone up, I think, and this is the inflation measure typically used.) Also, again, for FY 2010, note that I did not include that one-time adjustment discussed above.
The main takeaway here is that what might seem like relatively minor funding cuts look a whole lot worse when you adjust for inflation (the red line). The chart makes it clear that suing the standard measure of inflation, the 2016 appropriation was about 19% less than 2002’s appropriation in real dollars.
Here is the same data in chart form. The three two columns show you the appropriation history for adult education from 2002 through 2016. The fourth column provides the inflation percentage change from the previous year. Using those inflation rates, the fifth column shows you the value of each year’s state grant allocation in 2002 dollars.
| Year | Total Appropriation | State Grants Only | Annual Infl. % |
State Grants 2002 Dollars | % +/- |
| 2016* | $595,667,000 | $581,955,000 | 1.0 | $458,296,351 | -18.9% |
| 2015 | $582,667,000 | $568,955,000 | 0.1 | $428,051,225 | -24.2% |
| 2014 | $577,667,000 | $563,955,000 | 1.6 | $428,559,312 | -24.1% |
| 2013 | $574,667,000 | $563,955,000 | 1.5 | $435,511,349 | -22.9% |
| 2012 | $606,295,000 | $594,993,000 | 2.1 | $466,211,228 | -17.5% |
| 2011 | $607,443,000 | $596,120,000 | 3.2 | $476,760,609 | -15.6% |
| 2010** | $593,661,000 | $582,315,000 | 1.6 | $480,419,759 | -14.9% |
| 2009 | $567,468,000 | $554,122,000 | -0.4 | $464,659,000 | -17.7% |
| 2008 | $567,468,000 | $554,122,000 | 3.9 | $463,006,145 | -18.0% |
| 2007 | $579,563,000 | $563,975,000 | 2.8 | $489,431,514 | -13.3% |
| 2006 | $579,552,000 | $563,975,000 | 3.2 | $503,269,608 | -10.9% |
| 2005 | $585,406,000 | $569,672,000 | 3.4 | $524,751,509 | -7.1% |
| 2004 | $590,233,000 | $574,372,000 | 2.7 | $547,006,561 | -3.2% |
| 2003 | $587,217,000 | $561,162,000 | 2.3 | $548,658,188 | -2.9% |
| 2002 | $591,060,000 | $564,834,000 |
Two things I need to add anytime I post on the federal budget and adult education:

ILD 2016 Poster – Click for full size
Today is the 50th anniversary of International Literacy Day (ILD), an annual observance promoted by UNESCO to “actively mobilize the international community and to promote literacy as an instrument to empower individuals, communities and societies.”
UNESCO is celebrating ILD’s 50th anniversary under the banner “Reading the Past, Writing the Future,” in recognition of the past five decades of national and “international engagement, efforts and progress made to increase literacy rates around the world.”
The main global celebration of the day takes place at UNESCO’s headquarters in Paris, in the form of a two-day conference and the awarding of UNESCO’s International Literacy Prizes for 2016. In addition, a new program, the Global Alliance for Literacy (GAL) will be launched. UNESCO calls GAL a “new and ambitious initiative to make all major stakeholders pull together to promote literacy as a foundation for lifelong learning.”
There are events, articles, and statements from government officials around the globe today to mark the occasion. ILD celebrations are generally more prominent outside of the Unites States, although many U.S. adult literacy programs mark the day as well. This UNESCO page has links to some of the more prominent ILD 2016 events.
I find that ILD provides a good opportunity to explore literacy efforts outside the U.S., and so I always take some time out on September 8 to explore ILD-related activities in other countries. If I have time today, I will post a few links.
For those of you who are fans of infographics, here is the official UNESCO ILD 2016 infographic (click on it to see the entire thing):

The Wall Street Journal reported yesterday that while manufacturing has experienced some modest job growth lately, manufacturers are struggling to fill their open jobs. The story notes that the number of open manufacturing jobs has steadily risen since 2009, and that openings in manufacturing are at their highest level in 15 years.
I’m always a little suspicious, though, when anyone starts the ticker in 2009, which was when we were in the middle of one the worst recessions in history. Pretty much everything looks better if you start in 2009. It’s worth pulling the data from further back in time to get a better a better perspective on this recent growth:
Total U.S. Job Openings, Manufacturing, Dec. 2000 – Jun. 2016 (In thousands, seasonally adjusted). Source: Bureau of Labor Statistics
Here you can see that, yes, manufacturing job openings have rebounded since 2009, although they really had nowhere to go but up. In fact, they’ve climbed back to just about where they were in 2006. (We hit a high of 396,000 openings in April of that year, and there were 397,00 openings in April of this year.) So actually they are possibly at their highest levels in ten years, not fifteen.
But equally important is just how many more openings there were 15 years ago, if that’s what you count as your high-water mark (the BLS data only goes back as far as December of 2000). In January of 2001, there were an estimated 496,000 open jobs in manufacturing—100,000 more than there are today.
The second thing that I think is worth pointing out is that while job openings in manufacturing have been on the rise recently, employment in manufacturing has been on the decline for decades, and I don’t think anyone sees it coming back to where it was a few decades ago. Here’s another chart from the BLS showing the number of people employed in the manufacturing sectors since 1979:
All Employees, Manufacturing, Dec. 2000 – Jun. 2016. (In thousands, seasonally adjusted). Source: Bureau of Labor Statistics
In this instance, the BLS data goes back to the 1930s, but I started at 1979 because this is the high-water mark for manufacturing employment in this country. (And remember, there were fewer people in the labor force back then, and, well, fewer people, period, so the percentage of people working in the sector was much higher than today.) But you can see that manufacturing jobs started rapidly disappearing in the 2000s, and really cratered during the Great Recession. So the sector has come back a little bit, but it’s nowhere near where it once was.
Executives told the Journal that the reason that jobs are going unfilled is because they can’t find workers with the skills to run the advanced machinery these companies have invested in. (The machinery that in many cases allowed them to lay off all of their lower-skilled workers to begin with.) But let’s say that we did give all those lower skilled factory workers who got laid off over the last 15 years the skills employers say they need—I think it’s unlikely, looking at the chart above, that the sector is would produce enough new jobs in the foreseeable future to hire them all back again.
(Let’s table, for the purposes of this discussion, the argument as to whether, in certain cases, employers have a moral responsibility to do more than just hang up a “Help Wanted” sign and hope for the best in those communities that were hit hard when all that advanced machinery enabled them to cut a bunch of jobs. Some might argue that these employers ought to stop complaining and invest in what is needed to skill up those folks for these new openings. I’ll let you make up your own minds about that.)
It’s also worth noting—again—that there are those who study this stuff who argue that the skills gap in manufacturing is overblown. I’m reminded also, of this paper, published a few years ago by the Federal Reserve Bank of Boston, which found that as a result of the Great Recession and the high unemployment rate that followed, employers simply got used to being able to hire workers with relatively high skills at a fairly low wage, a trend the study authors called “opportunistic upskilling.” Once the labor market tightened up again, hiring and retaining a workforce of higher-skilled people across the board was clearly going to be more challenging. They expected employers to adjust, by either lowering their skill requirements for some of these jobs or by raising wages. Those unwilling to do so would find that the average time to fill a position would grow longer. I have no idea if that is what’s going on at some of the companies highlighted in this article—but it could be!
The point of all of this is—it’s complicated. I don’t have any doubt that many manufacturing jobs require more advanced skills than they did a decade or two ago, but a reluctance by employers to raise wages, or to look at lowering the skill requirement for some jobs (and/or investing in more training on the job) may also be factors.
Why do I care about this? Well, because from a workforce training/adult education perspective, I want know with as much precision as I can what the actual employment trends are in order to figure out what the actual need for training really is, and whether there are other things we need to look at in order to get people into (or back into) a job.
