A few years ago I started tracking the annual federal appropriation for adult education under the Adult Education and Family Literacy Act (AEFLA, incorporated as Title II of the Workforce Investment Act and later the Workforce Innovation and Opportunity Act), in both nominal amounts and, importantly, in inflation-adjusted dollars. I’ll update this again at the end of the year once the final annual inflation rate is announced, but in light of the fact that Congress will be coming back next month to finish up the FY 2017 appropriations process (several months after it should have been completed), I thought it might be a good idea to post a preliminary update now, so everyone is clear on how small the federal investment in adult education has been over the last 14 years.
Let’s start with a chart included every year in the Committee for Education Funding’s annual “Budget Response” book, in the article on AEFLA (an article I have written the last several years, I should add). It shows the nominal amounts appropriated for AEFLA state grants since 2002:

There are actually two line items for AEFLA funds in the federal budget: Adult Education State Grants and National leadership Activities (AEFLA section 242). We highlight the state grants line item in the CEF book because those are the dollars that are distributed by formula to states to actually fund adult education programs. (It is also by far the larger of the two amounts.) See this old post for an explanation of how the funding for adult education is divided up.
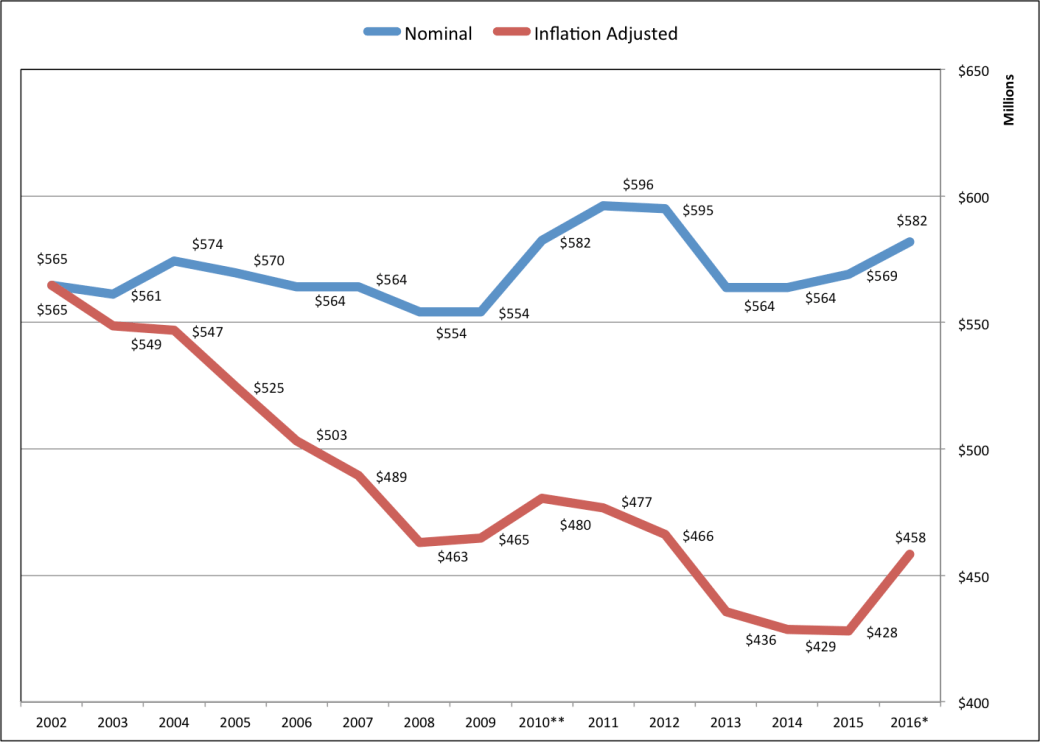
Looking quickly at this bar chart, you might be tempted to think that AEFLA state grant funding has been fairly steady—the bars look pretty even—but if you look closely you can see that there was a rather dramatic drop in funding in 2013. This was the year we (along with every other federal non-defense discretionary program) got socked with the sequester, an automatic spending cut required by the Budget Control Act (BCA) of 2011. It doesn’t look that dramatic in this chart, but this was a cut of over $30 million dollars—a significant loss of funding when you consider our entire appropriation for this line item is less than $600 million. While there has been minor sequester relief since then, you can also see from this chart that, as of FY 2016, we have not yet returned to pre-BCA funding levels.
A couple of additional notes about this chart:
- Back in 2009, an injection of new, one-time funding for many education programs was included the American Recovery and Reinvestment Act (ARRA). CEF’s charts indicate this with a separate bar (FY 2009 ARRA). AEFLA did not receive any funding from ARRA, which is why there is a big zero there in this part of the AEFLA chart.
- In 2010, however, AEFLA state grants did receive a modest injection of new funds from a one-time adjustment made by the Department of Education to make up for several years of underpayment to some states. That anomaly wasn’t carried over to future years, and it shouldn’t be interpreted as growth. The actual appropriation that year without that anomaly would have been $582 million, which, interestingly enough, is where we find ourselves today.
Last year, thanks in large part to the efforts of Rep. Rosa Delauro (D-CT) and other House appropriators, AEFLA state grants got its most significant bump up in a while in the FY 2016 omnibus spending bill ($13 million), but, again, it’s important to note that AEFLA funding has still not yet returned to the pre-2013 levels. In addition, the overall appropriation for AEFLA in FY 2016 ($585 million) is considerably less than the amount authorized for AEFLA under WIOA ($622 million).
The situation looks considerably worse once inflation is taken into account. The buying power of 2016 dollars is less than it was in 2002. This chart shows the buying power of the AEFLA appropriation since 2002 in 2002 dollars.
Data Sources: U.S. Dept. of Education, OVAE and the U.S. Bureau of Labor Statistics, except as noted below.
*Actual 2010 appropriation included a $45,906,302 one-time adjustment. This is not included.
**Average inflation rate over the first nine months of 2016.
My inflation calculation from 2016 is using the average monthly CPI through September, so it’s a rougher estimate (for the other years I can use the annual average), but it’s good enough. (I realize also that there is debate about whether the CPI is a meaningful way to measure the rate of inflation for the costs related to running an education program, but it’s fairly standard to use this measure. We can all agree that cost have gone up, I think, and this is the inflation measure typically used.) Also, again, for FY 2010, note that I did not include that one-time adjustment discussed above.
The main takeaway here is that what might seem like relatively minor funding cuts look a whole lot worse when you adjust for inflation (the red line). The chart makes it clear that suing the standard measure of inflation, the 2016 appropriation was about 19% less than 2002’s appropriation in real dollars.
Here is the same data in chart form. The three two columns show you the appropriation history for adult education from 2002 through 2016. The fourth column provides the inflation percentage change from the previous year. Using those inflation rates, the fifth column shows you the value of each year’s state grant allocation in 2002 dollars.
| Year | Total Appropriation | State Grants Only | Annual Infl. % |
State Grants 2002 Dollars | % +/- |
| 2016* | $595,667,000 | $581,955,000 | 1.0 | $458,296,351 | -18.9% |
| 2015 | $582,667,000 | $568,955,000 | 0.1 | $428,051,225 | -24.2% |
| 2014 | $577,667,000 | $563,955,000 | 1.6 | $428,559,312 | -24.1% |
| 2013 | $574,667,000 | $563,955,000 | 1.5 | $435,511,349 | -22.9% |
| 2012 | $606,295,000 | $594,993,000 | 2.1 | $466,211,228 | -17.5% |
| 2011 | $607,443,000 | $596,120,000 | 3.2 | $476,760,609 | -15.6% |
| 2010** | $593,661,000 | $582,315,000 | 1.6 | $480,419,759 | -14.9% |
| 2009 | $567,468,000 | $554,122,000 | -0.4 | $464,659,000 | -17.7% |
| 2008 | $567,468,000 | $554,122,000 | 3.9 | $463,006,145 | -18.0% |
| 2007 | $579,563,000 | $563,975,000 | 2.8 | $489,431,514 | -13.3% |
| 2006 | $579,552,000 | $563,975,000 | 3.2 | $503,269,608 | -10.9% |
| 2005 | $585,406,000 | $569,672,000 | 3.4 | $524,751,509 | -7.1% |
| 2004 | $590,233,000 | $574,372,000 | 2.7 | $547,006,561 | -3.2% |
| 2003 | $587,217,000 | $561,162,000 | 2.3 | $548,658,188 | -2.9% |
| 2002 | $591,060,000 | $564,834,000 |
Two things I need to add anytime I post on the federal budget and adult education:
- The sequester and the overall budget caps that Congress imposed on itself with the BCA has resulted in spending cuts and freezes for many, many federal discretionary programs, not just AEFLA. Few education programs have received any funding increases since the BCA passed, and many have suffered worse than AEFLA. It would be a mistake to infer from this post that Congress, or Congressional appropriators, have something against adult education specifically, and are cutting our funds while enriching other education programs. That’s not the case at all. It is, however, fair to say that post-BCA, when subsequent budget deals lifted those caps a tiny bit, adult education has not received much benefit. We do need more awareness and more champions in Congress to take advantage of those opportunities when they occur. But no matter how good our advocacy is, substantial funding increases will not be on the table until Congress does something about those caps. I can’t emphasize this point enough. It’s why I have personally invested so much time with CEF and in federal budget advocacy overall the last several years. Federal education funding is in crisis across the board.
- Also, remember that not all federal adult education spending comes out of AEFLA. Community Development Block Grants, AmeriCorps funding, Perkins/CTE, funding for immigration programs, and some other pots of education money are also sources of funding for some adult education programs and activities. So if you care about federal adult education spending, there are other programs you need to track.
 I tweeted this earlier but in case you are walled out by their subscriber paywall, here’s a fair use except of an interesting